laravel-chartjs
Laravel Chart.js User Guide
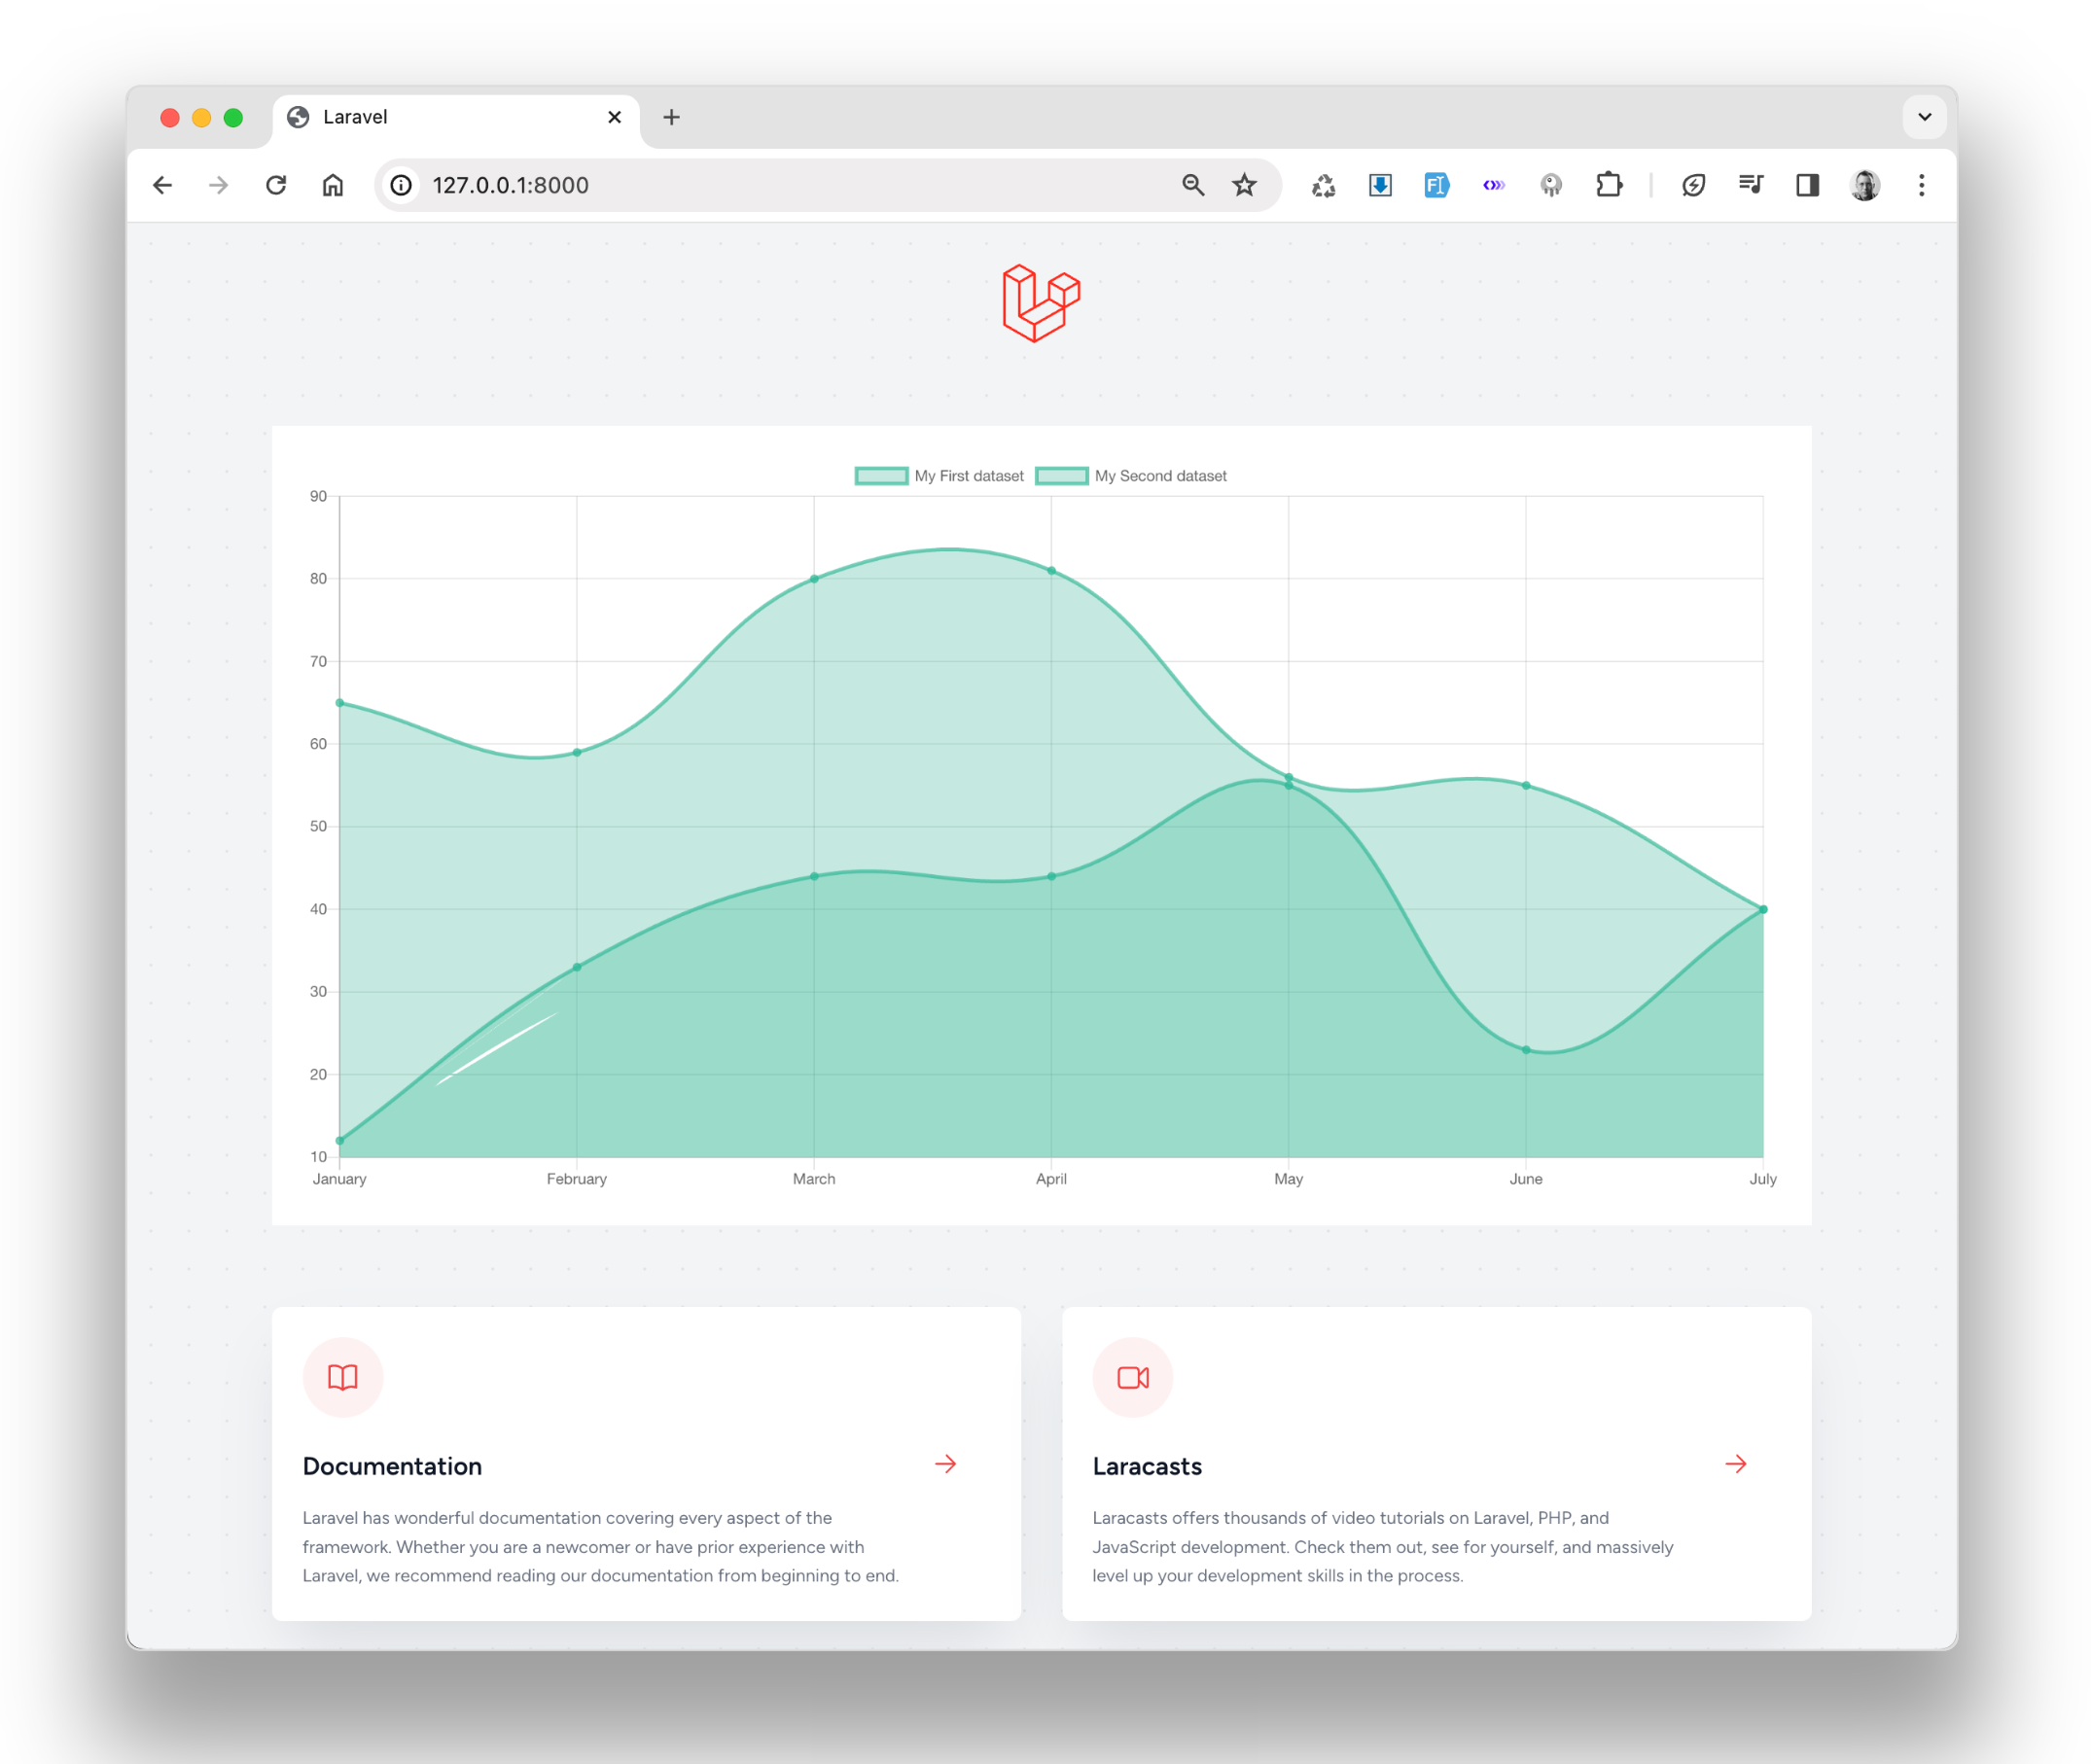
Welcome to the Laravel Chartjs graphs and charts package for Laravel. This page will walk you through the process of creating a chart in a Laravel application using the Laravel Chartjs package, with data from a User model.
Prerequisites
Before you begin, ensure you have the following:
- Laravel application installed and set up
- LaravelChartjs package installed
- User model with relevant data (e.g., registrations over time)
Installation
If you haven’t already installed LaravelChartjs, you can do so via composer:
composer require icehouse-ventures/laravel-chartjs
Configuration
Publish the configuration file to customize the package settings:
php artisan vendor:publish --provider="IcehouseVentures\LaravelChartjs\Providers\ChartjsServiceProvider" --tag="config"
In the config/chart.js.php set the Chartjs version to 4 to use the newest version of Chartjs, and the delivery method to CDN for rapid setup and easy testing.
Creating a Chart
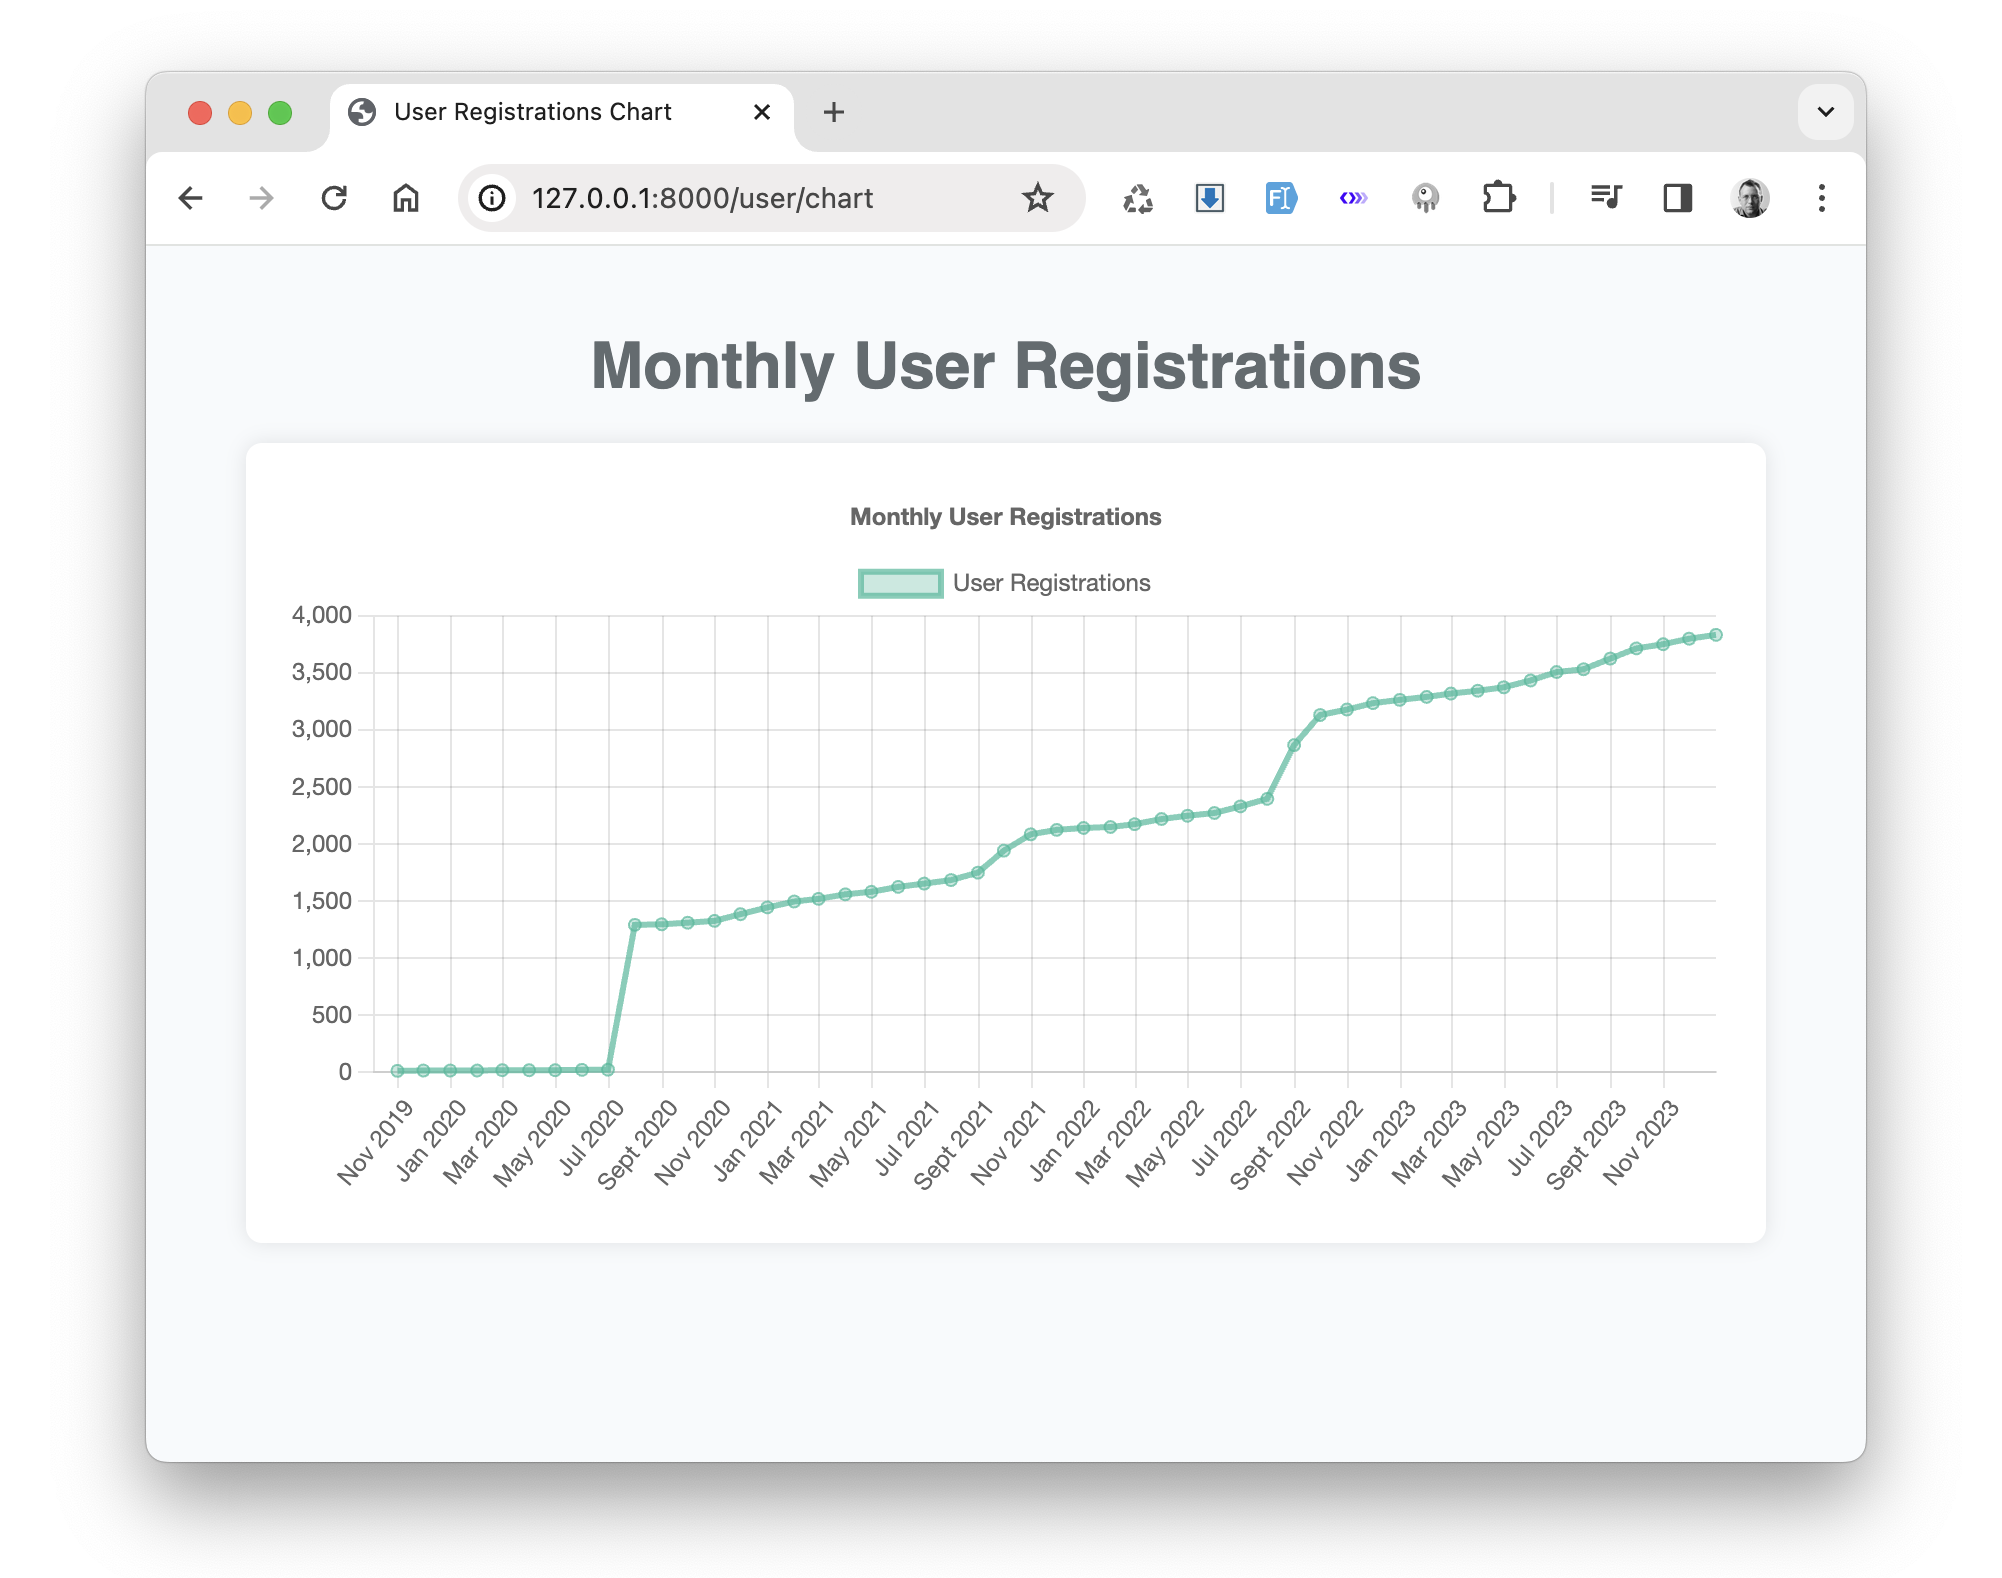
In this example, we’ll create a line chart displaying user registrations per month.
1. Prepare Data
First, we need to prepare the data for the chart. In your UserController, add the following method to aggregate user registrations. Next, use the data to create the chart:
namespace App\Http\Controllers;

use App\Models\User;
use Carbon\Carbon;
use Carbon\CarbonPeriod;
use Illuminate\Support\Collection;
use IcehouseVentures\LaravelChartjs\Facades\Chartjs;


class UserController extends \App\Http\Controllers\Controller
{

    public function showChart()
    {

        $start = Carbon::parse(User::min("created_at"));
        $end = Carbon::now();
        $period = CarbonPeriod::create($start, "1 month", $end);

        $usersPerMonth = collect($period)->map(function ($date) {
            $endDate = $date->copy()->endOfMonth();

            return [
                "count" => User::where("created_at", "<=", $endDate)->count(),
                "month" => $endDate->format("Y-m-d")
            ];
        });

        $data = $usersPerMonth->pluck("count")->toArray();
        $labels = $usersPerMonth->pluck("month")->toArray();

        $chart = Chartjs::build()
            ->name("UserRegistrationsChart")
            ->type("line")
            ->size(["width" => 400, "height" => 200])
            ->labels($labels)
            ->datasets([
                [
                    "label" => "User Registrations",
                    "backgroundColor" => "rgba(38, 185, 154, 0.31)",
                    "borderColor" => "rgba(38, 185, 154, 0.7)",
                    "data" => $data
                ]
            ])
            ->options([
                'scales' => [
                    'x' => [
                        'type' => 'time',
                        'time' => [
                            'unit' => 'month'
                        ],
                        'min' => $start->format("Y-m-d"),
                    ]
                ],
                'plugins' => [
                    'title' => [
                        'display' => true,
                        'text' => 'Monthly User Registrations'
                    ]
                ]
            ]);

        return view("user.chart", compact("chart"));

    }
}
3. Display Chart in View
Create a Blade file named chart.blade.php in the resources/views/user directory and add the following code to render the chart:
<!DOCTYPE html>
<html lang="en">
<head>
    <title>User Registrations Chart</title>
</head>
<body>
    <h1>Monthly User Registrations</h1>
    <div style="width:75%;">
        <x-chartjs-component :chart="$chart" />
    </div>
</body>
</html>
4. Route Configuration
Make sure to add a route to display the chart:
Route::get('/user/chart', 'UserController@showChart');
5. Conclusion
You’ve now created a line chart displaying user registrations per month using the LaravelChartjs package. Visit /user/chart in your Laravel application to view the chart.
For more advanced usage and customization options, refer to the official Chart.js documentation.
Advanced Customization
To further customize your charts, you can modify the following properties:
- Colors: Change the
backgroundColorandborderColorproperties in the datasets to alter the chart’s appearance. - Tooltips: Enable and customize tooltips by adding a
tooltipskey in theoptionsarray. - Axes: Adjust the axes settings under the
scaleskey to change the display format or scale type.
Refer to the Chart.js documentation for a full list of customization options.
Troubleshooting and Debugging
If you encounter issues while creating or displaying charts, here are some common problems and their solutions:
- Chart not displaying: Ensure that the route is correctly configured and that the view file is properly named and located in the correct directory.
- Data not appearing correctly: Check that your data aggregation logic in the
UserControlleris correct and that the database query returns the expected results. - Styling issues: Verify that the chart options are set correctly and that any custom CSS is properly linked to the Blade view file.
For more detailed error messages, check the Laravel log files, and for browser-related issues, inspect the console for JavaScript errors.
Additional Resources
-
GitHub Repository: View source code and installation instructions: github.com/icehouse-ventures/laravel-chartjs
-
Packagist: Laravel package setup using php composer: packagist.org/packages/icehouse-ventures/laravel-chartjs
-
Wiki: Upgrade guides for older Chart.js and package versions and general information: github.com/icehouse-ventures/laravel-chartjs/wiki
-
Discussions: For support, tips and suggestions: github.com/icehouse-ventures/laravel-chartjs/discussions